The Analysis function provides the ability to view graphical, interactive Analysis reports based on a Power BI view of the same Nebula usage data provided in the Reports function. Analysis reports provide a higher-level dashboard into your EA usage, allowing you to more easily analyze the data for insights and trending.
Within the Analysis function, the system may offer different Analysis reports. The data and presentation of Analysis report may differ, but the methodology to generate an Analysis report remains the same. This article covers how to generate any Analysis report. For details on what’s in the reports, see the article specifically describing the Analysis report you’re generating. A link to all of these articles is included in Introduction to Analysis (Power BI) Reports.
1. Log in to the UI and then click on the Analysis button:
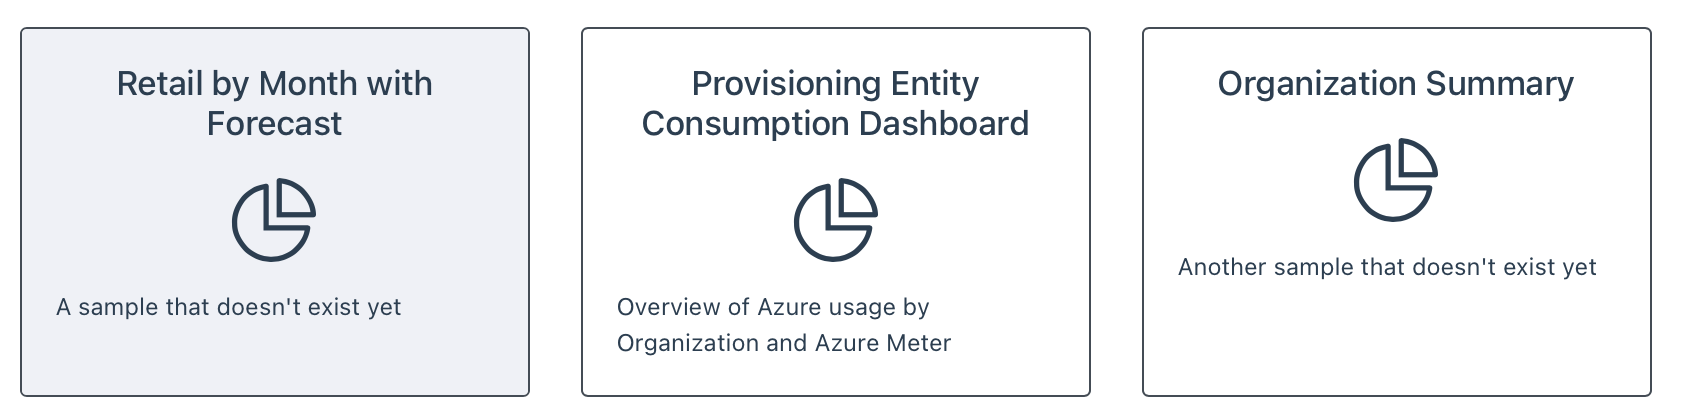
2. The system will offer one or more Analysis reports. Click on the tile of the Analysis report you want to generate:
3. The Analysis dialog will open for the selected report:
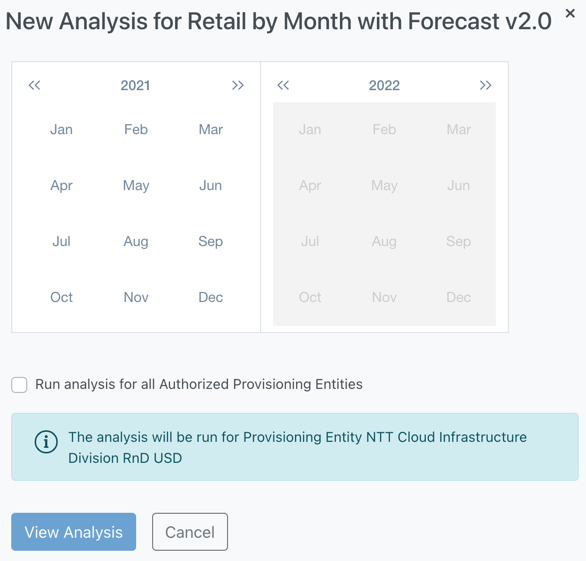
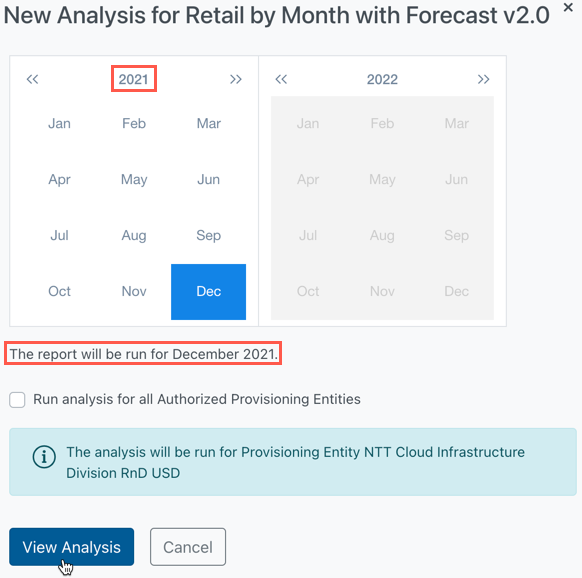
4. You can generate the report for a single month, or for a range of months. To generate the report for a single month, click on the month for which you would like to generate the report. Be sure to select the month that corresponds with the correct year. The dialog will indicate the month for which the report will be generated. Then, click the View Analysis button:
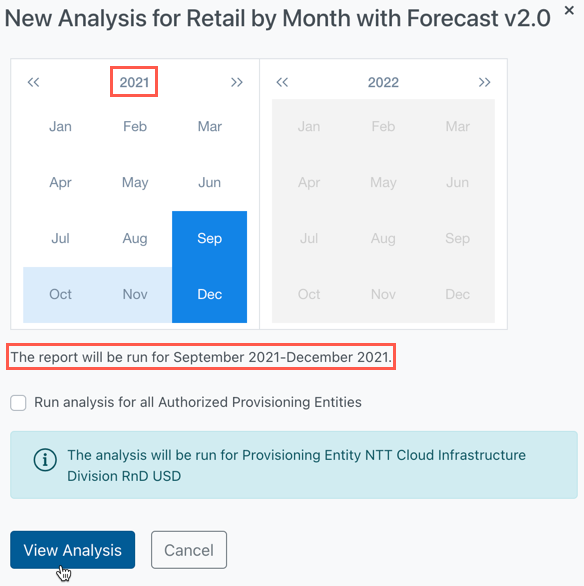
To generate a report for a range of months, click on the month you want to be the beginning of the report, then select the end-month. Verify that the report will be run for the correct month(s) and year(s). The dialog will indicate the month range. Then, click the View Analysis button:
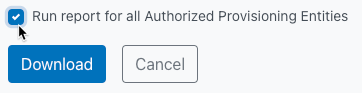
By default, the Power BI Analytics report will be loaded with usage data only for the currently selected Provisioning Entity (as chosen as described in How do I Switch between Provisioning Entities?). However, if you click the “Run analysis for all Authorized Provisioning Entities” checkbox, the Analytics report will load with data for all Provisioning Entities to which you have access. See the article on the specific Power BI Analysis report you are generating for details on how the report behaves with data from multiple Provisioning Entities.
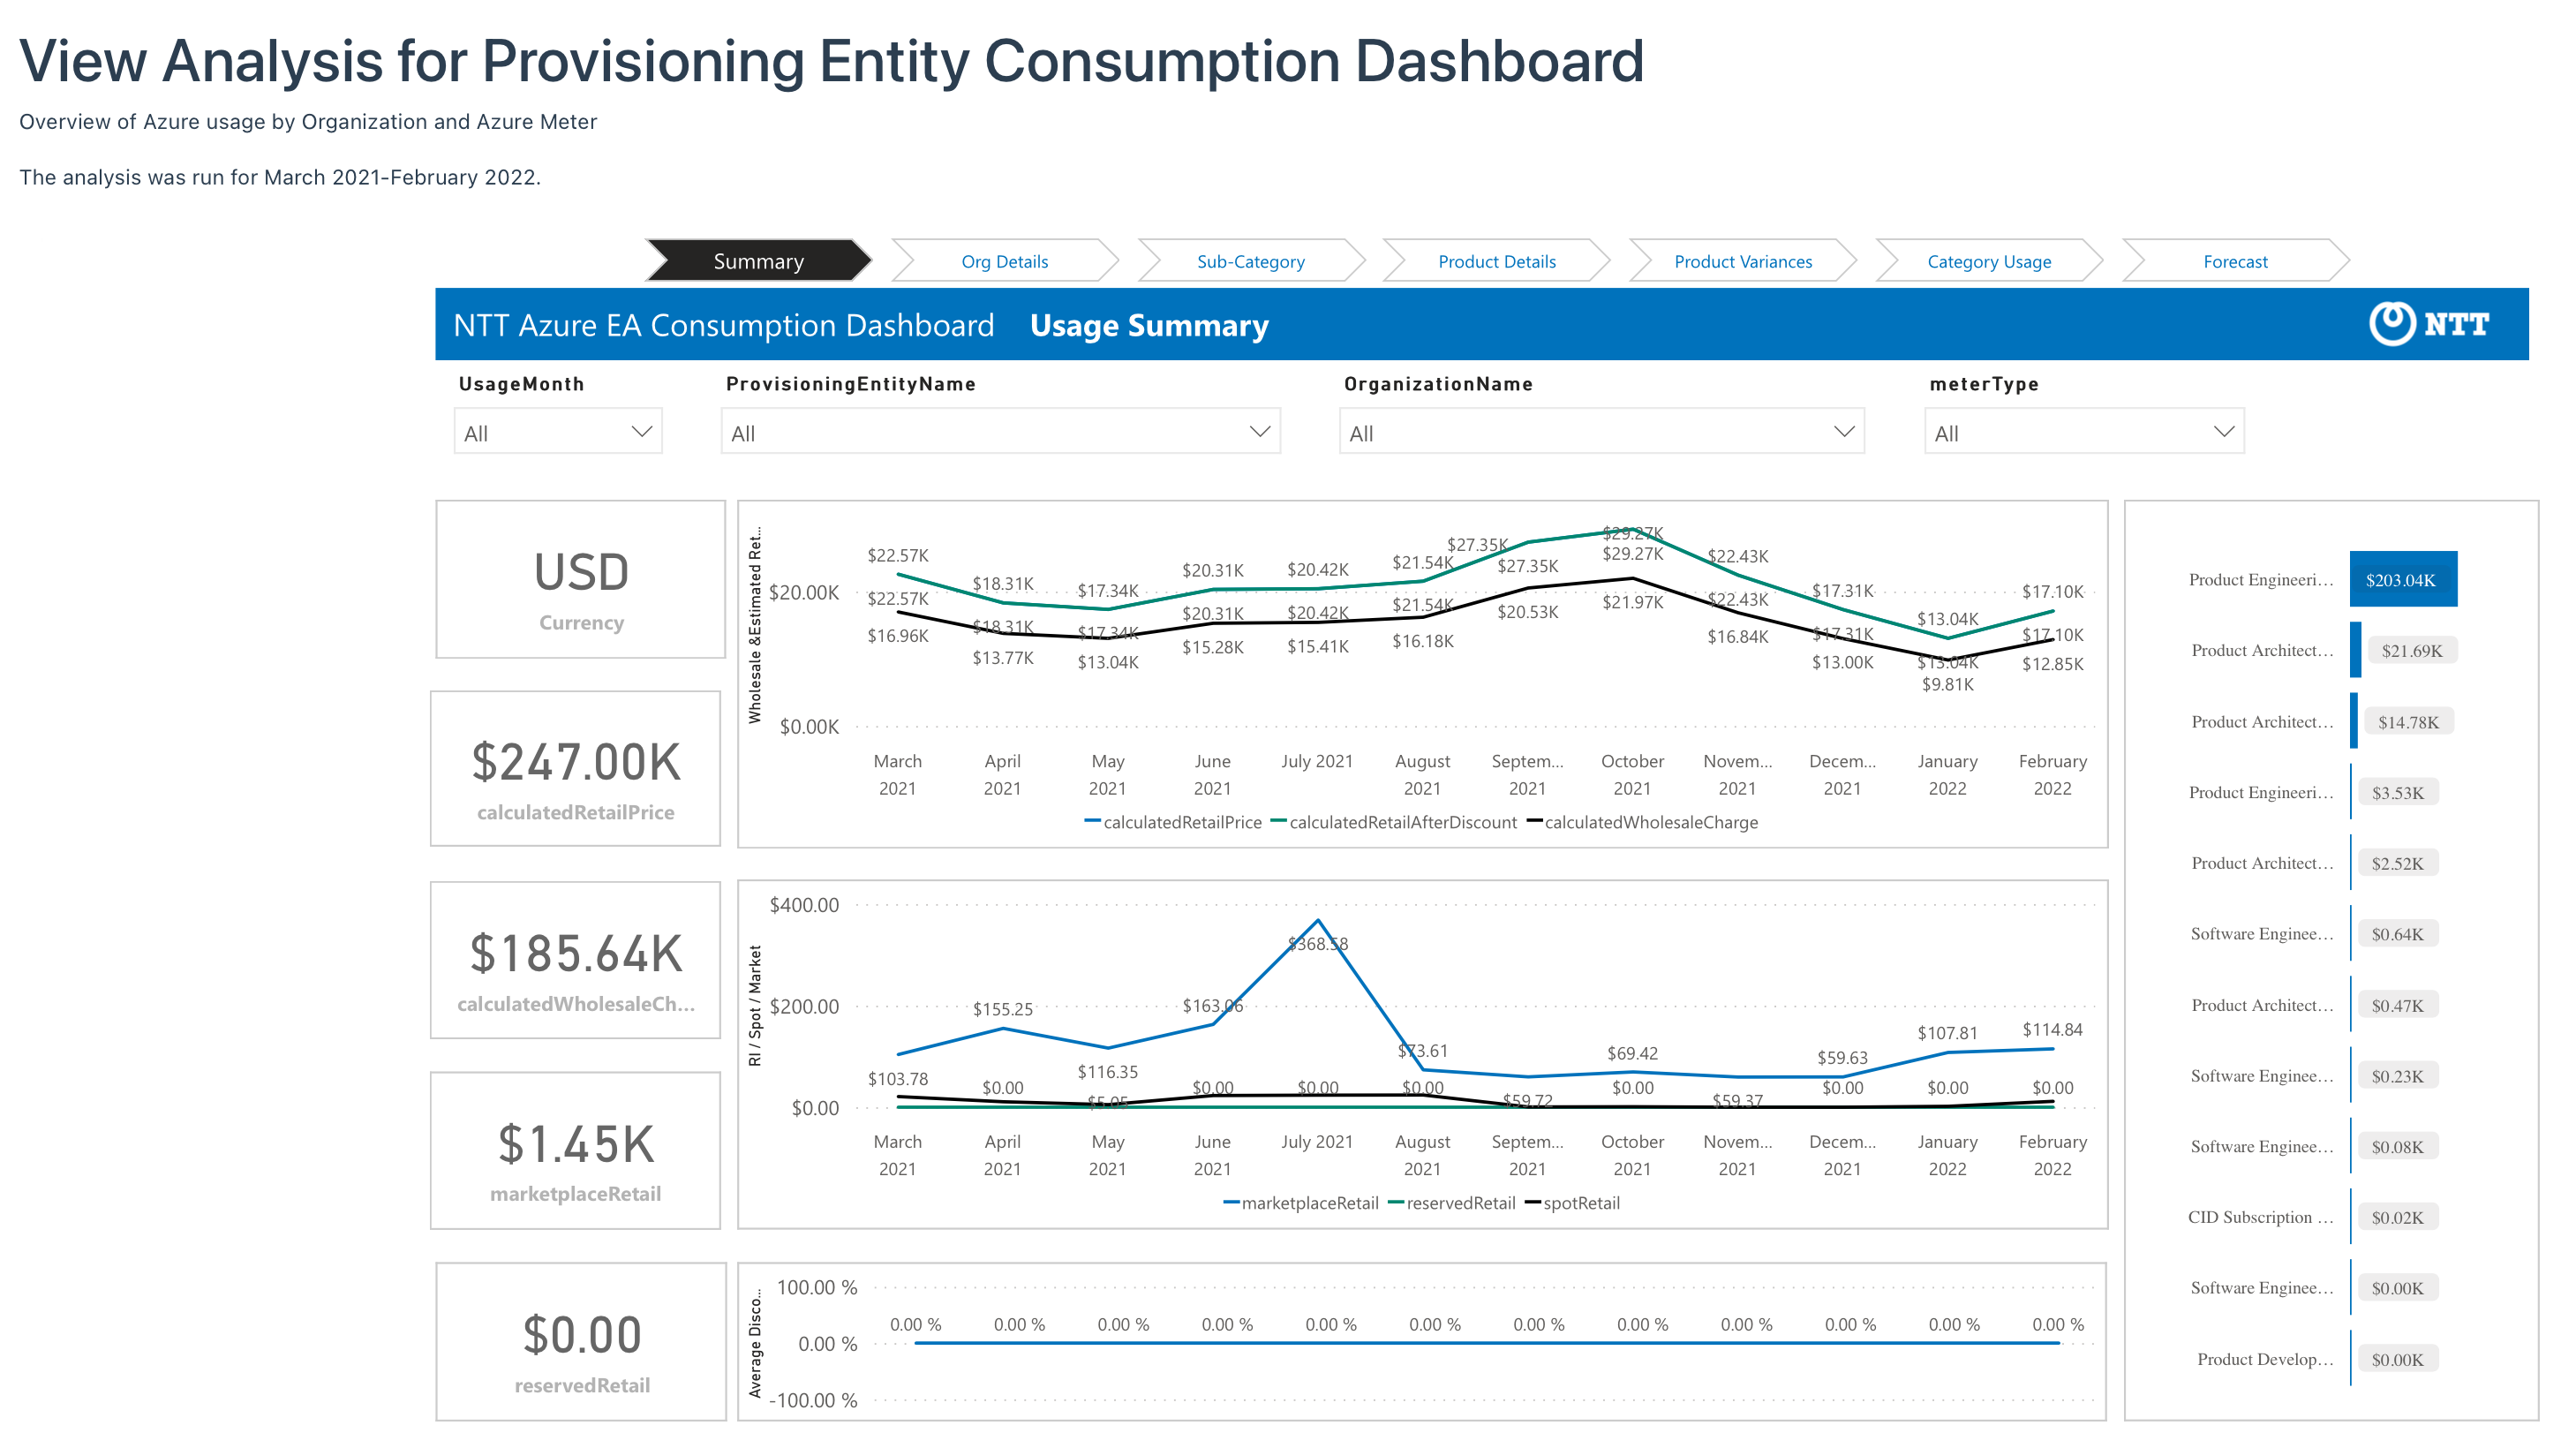
5. The report will be displayed in the UI: